


For procurement teams and commercial evaluators, a truck tire retreadability comparison should go beyond purchase price and tread life to assess lifecycle value.
Casing rejection rates show how often inspected tires fail to qualify for retreading, helping buyers estimate replacement needs and potential recovery of casing value.
However, a lower rejection percentage supports a purchasing decision only when inspection criteria, operating conditions, and the population of submitted casings are comparable.
The strongest evaluation combines rejection reasons, acceptance yield, and lifecycle costs. This guide explains how to build that comparison and challenge misleading supplier claims.
What does a casing rejection rate actually tell you?
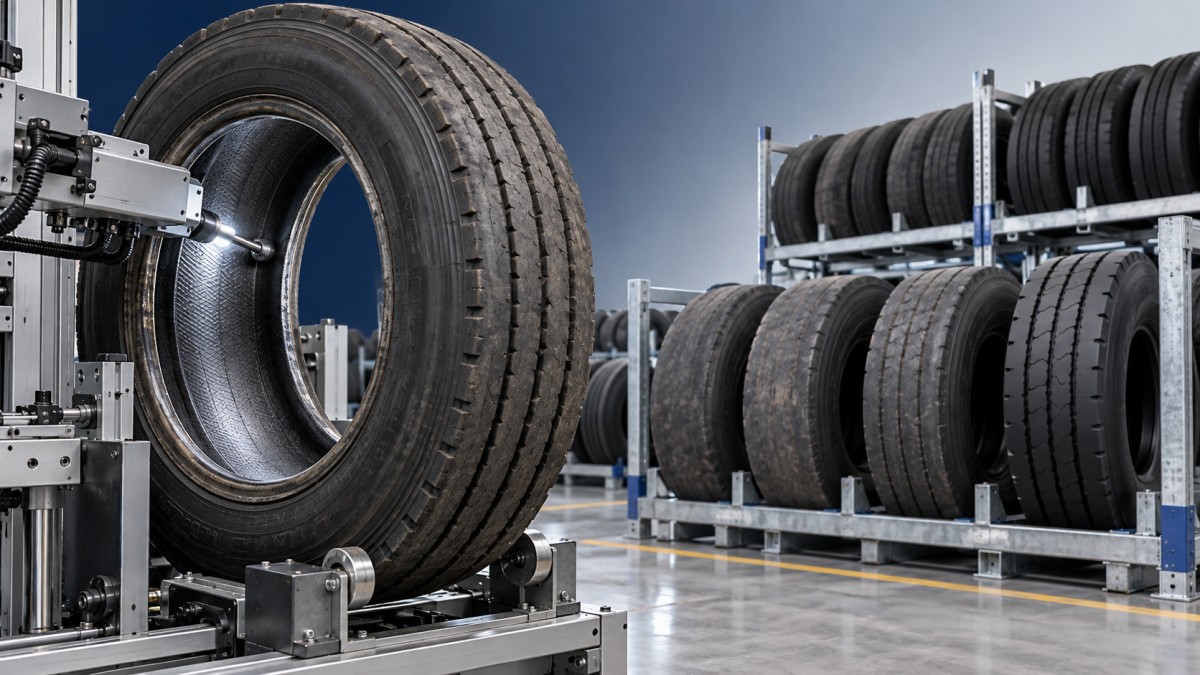
A casing rejection rate measures the proportion of inspected casings that a retreader declines. It describes acceptance under specific conditions, rather than universal tire durability.
Calculate it by dividing rejected casings by all casings inspected at the defined inspection stage, then multiplying by 100 to express the result.
For example, if 80 of 400 inspected casings are rejected, the rejection rate is 20%, and the corresponding acceptance rate is 80%.
Specify whether rejection occurred during initial inspection, after buffing, or later processing. Combining stages without explanation can obscure where losses actually arise for buyers.
Also distinguish first retread eligibility from eligibility for subsequent retreads. Older casings with previous repair histories should not be pooled indiscriminately with first-life casings.
Acceptance does not guarantee a completed retread or satisfactory service afterward. Track processing losses and subsequent performance separately when estimating the full commercial benefit.
Are suppliers measuring the same population?
The most consequential comparison error is often denominator selection. A supplier submitting only promising casings can report better results without delivering better fleet outcomes.
Request counts for tires removed, casings collected, casings inspected, accepted casings, and completed retreads. Reconcile missing casings and explain exclusions before comparing supplier percentages.
Keep a separate measure for acceptance yield: accepted casings divided by all tires removed within the defined fleet cohort, including documented losses before inspection.
This measure captures collection failures, obvious damage, and other exclusions that an inspection-only rejection rate misses. Both measures matter, but they answer different questions.
The following illustrative comparison shows why a lower reported rejection rate may produce fewer accepted casings from an equally sized group of removed tires.
Supplier B looks stronger using inspection rejection alone. Supplier A delivers more accepted casings per removal, although operating conditions and exclusion reasons still require investigation.
Which conditions must match before the comparison is credible?
Group tires by size, construction, axle position, duty cycle, and retread history. Compare equivalent applications before interpreting any difference as evidence of casing quality.
Record mileage or operating hours, casing age, load exposure, inflation practices, and removal policy. A tire removed earlier may preserve more potential casing value.
However, earlier removal can sacrifice original tread utilization. Evaluate that tradeoff alongside retread acceptance, rather than rewarding acceptance improvements that raise total operating costs.
Use the same qualified retreader where practical, with consistent inspection methods and documented acceptance criteria. Different retreaders may apply different repair limits or application restrictions.
Include collection dates and storage conditions. Exposure, handling damage, and delayed submission can affect results independently of the tire supplier or original casing construction.
Off-road applications need particular care. Cuts, impacts, and terrain exposure can dominate rejection patterns, making comparisons with highway fleets commercially misleading without separate analysis.
For example, SL808 is described as a mud-terrain tire for off-road trucks, with LT options including 285/70R17LT-8PR and 37X13.50-17LT-10PR for challenging terrain applications.
Its application and listed load ratings help define a relevant purchasing cohort. They do not establish retread eligibility, casing rejection performance, or guaranteed retread cycles.
Which rejection reasons point to a supplier issue?
A single percentage cannot explain why casings fail inspection. Require standardized reason codes, supported by inspection records and photographs where available, for each rejected casing.
Useful categories include impact damage, penetrations, bead damage, heat-related deterioration, structural separation, excessive repairs, age limits, and exclusions under the retreader’s acceptance policy criteria.
Record one primary rejection reason and additional contributing observations. This prevents multiple defects on one casing from being counted as several rejected tires accidentally.
Repeated structural findings may justify a supplier investigation, but they do not establish a manufacturing defect without considering loading, inflation, repairs, and service history.
Likewise, impact damage may reflect route conditions, while bead damage may involve mounting or handling. Assign responsibility only after reviewing the supporting evidence carefully.
Compare reason-specific rejection rates against inspected casings within matched groups. A recurring pattern across comparable operations is more informative than isolated photographs or anecdotes.
Where inspection judgments differ, arrange a joint review with the retreader and supplier. Document disputed classifications and keep unresolved cases visible in the analysis.
How do rejection rates affect the business case?
Translate acceptance into money using actual casing credits, retreading charges, collection costs, repair costs, and expected service output. Avoid treating every accepted casing as equally valuable.
For a simple screening calculation, assume inspection rejection rises from 15% to 25% across 1,000 inspected casings. That produces 100 additional rejected casings overall.
If each accepted casing earns an actual $80 credit, the difference represents $8,000 in foregone credit, before collection expenses or other contractual adjustments apply.
This example measures casing recovery value only. A fleet retreading its own casings should instead compare complete lifecycle scenarios, including replacement purchases and retread performance.
Calculate cost per mile using net tire-related costs divided by verified service miles across original use and completed retreads, applying the same accounting boundaries.
Include original purchase price, retreading, repairs, inspection, logistics, disposal, and relevant downtime. Subtract documented credits once, without double-counting the same casing benefit elsewhere again.
A more expensive new tire can justify its premium if stronger casing recovery and useful retread mileage offset that premium under the fleet’s actual conditions.
Conversely, strong acceptance alone may not justify a premium when collection is unreliable, retreading costs are high, or subsequent service performance disappoints the fleet.
What evidence should buyers request before awarding business?
Ask suppliers for fleet-level data showing inspection dates, cohort definitions, sample counts, rejection stages, reason codes, retreader identity, and exclusions. Require traceability to individual casings.
Always report counts beside percentages. A 10% rejection rate from 20 casings carries much more uncertainty than the same percentage from 2,000 comparable casings.
When differences are small, review statistical uncertainty and commercial significance. A modest percentage advantage may disappear after adjusting for application mix or inspection practices.
If supplier evidence is incomplete, conduct a matched fleet pilot with agreed maintenance, removal rules, and inspection criteria. Track original service and subsequent retread outcomes.
Jinan Xinkunyu International Trading Co., Ltd. supplies truck tires alongside semi-steel radial and special tires. Commercial evaluations should request evidence for each proposed tire model.
Its stated manufacturing scale, technical staffing, and logistics coverage can inform supplier assessment, while retreadability conclusions still require comparable casing records and qualified retreader confirmation.
Before ordering, confirm the intended retreader accepts the specific size, construction, application, and casing history. Establish how inspection disputes and rejected casing costs will be handled.
Make the award decision on verified lifecycle value
A useful truck tire retreadability comparison connects consistent inspection rejection rates with acceptance yield, rejection causes, and the cost of delivering verified service mileage.
Prefer the supplier whose evidence supports better economics in your operating conditions. When evidence remains incomplete, make further volume commitments conditional on agreed pilot results.
The decisive question is whether usable casings return enough value to improve fleet economics. Rejection rates help answer it when their context is transparent.